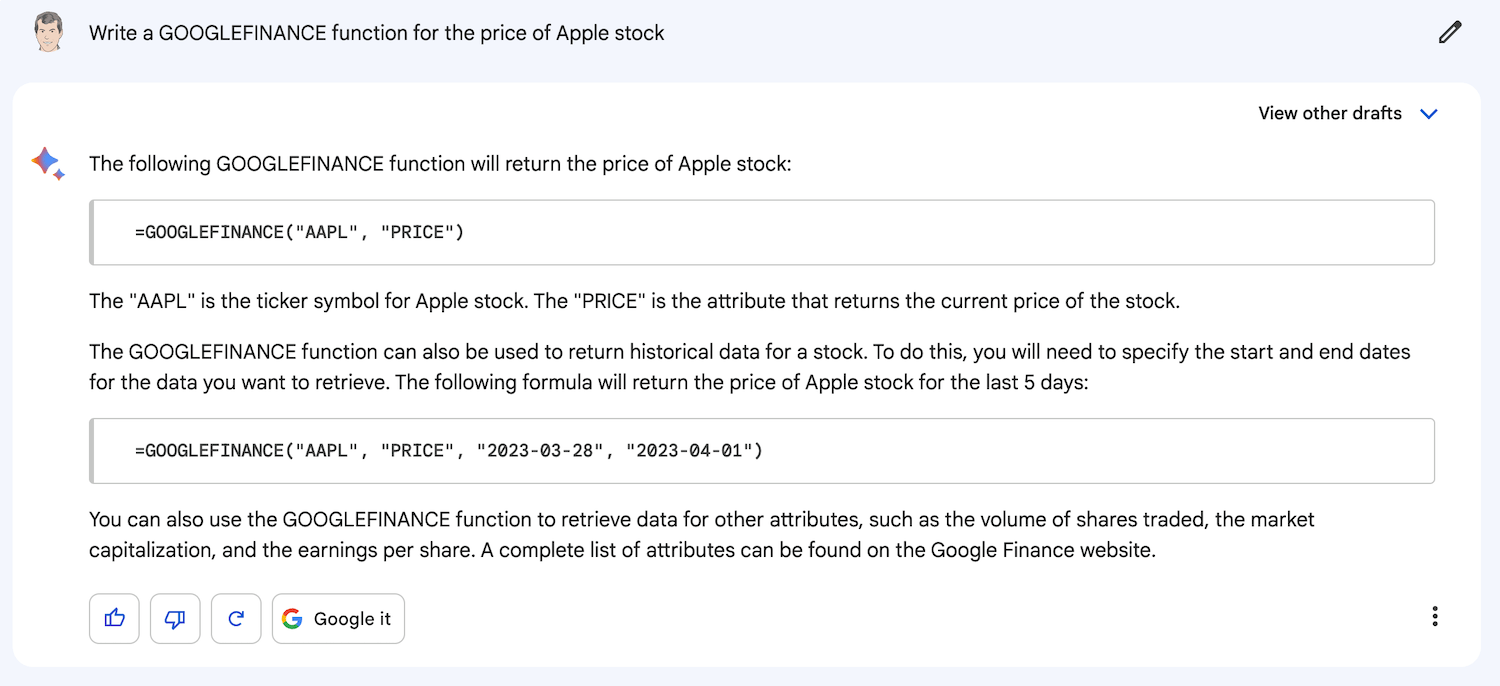
The GOOGLEFINANCE function is part of Google Sheets. Google Sheets is available in both consumer Gmail and organization-wide Google Workspace.
The function allows users to create trend charts and comparisons for financial assets with a valid Google Finance ticker symbol.
Here are several examples of how the GOOGLEFINANCE function can be used in Google Sheets to compare the performance of stocks and indexes against one another.
Google notes the following restrictions for its financial data: “The data is not for financial industry professional use or use by other professionals at non-financial firms (including government entities).”
As AI integration with Google Sheets continues to improve, users can generate better insights from the results of using this financial function.
GOOGLEFINANCE Function Examples
Apple vs. Meta vs. Alphabet Stock Price in Sheets
Apple, Meta, and Alphabet are three well-known Silicon Valley technology companies. The relative performance can be easily seen by creating a chart from three GOOGLEFINANCE functions. This is the Google Sheet. You can save it as a new Google Sheet.
By adding a column for each ticker, we can show the YTD percentage changes for each stock. Here is the Google Sheet.
If you open the sheet, you’ll see the formula we used to show the percentage change for each trading day from the first trading day of the year:
=IF(ISBLANK(B2),””,(B2/$B$2)-1)
Tip: you can ask Google’s Gemini to write formulas for you.

DJIA Trend vs. Max Close and Bear Line
It’s easy to chart a stock market index using the GOOGLEFINANCE function. More columns can be added to the spreadsheet to track performance against a target.
This chart shows the 2024 trend of the DJIA compared to the high water mark for the year. The chart includes a ‘bear line,’ which is 20% below the 2024 maximum. The MAXA function was used for the top line.
Here is a link to the Google Sheet. If you are logged into a Google account, you can save it as a new Google Sheet using File > Make a copy.
The Bitcoin trend can be displayed using a formula like =GOOGLEFINANCE(“CURRENCY:BTCUSD”, “price”, DATE(2024,1,1), DATE(2024,12,31), “DAILY”)
GOOGLEFINANCE does not provide data for precious metals such as gold and silver.
Stock Attributes
Using simple formulas, the values of various stock attributes can be displayed in a Google Sheet. For the example below, we chose CRM, the ticker for Salesforce.
Directly view the above Google Sheet.
Here are several examples from this Sheet that you can copy and paste into Google Sheets cells
| =GOOGLEFINANCE(“NYSE:CRM”,”closeyest”) |
| =GOOGLEFINANCE(“NYSE:CRM”,”pe”) |
| =GOOGLEFINANCE(“NYSE:CRM”,”high52″) |
Mutual Fund Attributes
Fund attributes can be similarly displayed in a Google Sheet as stocks. The following information is for the EuroPac International Value Fund.
Here is a link to the above Sheet.
Currency Exchange Trends
The following is an example of how to display the currency exchange trend during the last 30 days.
A Summary of Use Cases
Specific use cases for the GOOGLEFINANCE function include:
- Researching market opportunities: Track the performance of different stocks, ETFs, and other financial instruments. This information can help you identify potential investment opportunities.
- Monitoring your portfolio: Track the performance of your current investments. This information can help you ensure that your investments are on track and not taking on too much risk.
- Converting currencies: Convert currencies from one currency to another. This information is helpful if you are doing business internationally or if you are planning to travel to another country.
- Performing financial analysis: Perform various financial analyses, such as calculating returns on investment, tracking stock price movements, and identifying trends in the market.


