In 2013, we used SurveyMonkey Audience to collect data about CRM systems deployed at organizations across the U.S. The main question we asked in the survey was, “What is your organization’s primary CRM system?”
After the survey finished its run, SurveyMonkey provided us with a CSV file of the survey results from approximately 750 respondents. The first thing we did was upload the CSV file to Google Drive and then open the file with Google Sheets. Once we had the data in Google Sheets, we could easily create pivot tables and associated charts.
In our case, we wanted to slice and dice the data by company size and by U.S. market area, so we ended up with a lot of sheets.
At the time, we took screenshots of the Google Sheets pivot table charts and then uploaded PNG files to WordPress to display the survey results visually.
It turns out that another way we could have displayed the charts would have been to embed code provided by Google Sheets and create a more interactive visitor experience. For example, hovering over a pie chart slice “pops” the slice and displays more data behind the slice in an embedded pivot table chart.
Embedding the charts would have also allowed us to make small changes to the charts within the sheets and have those changes auto-update on the blog post.
Since 2013, Google has changed the embed code parameters. Google will likely change them again, but here’s a look at how to work with the current embed code.
If you don’t know how to create a pivot table in Google Sheets, here’s a quick tutorial.
Create a Chart From a Pivot Table in Google Sheets
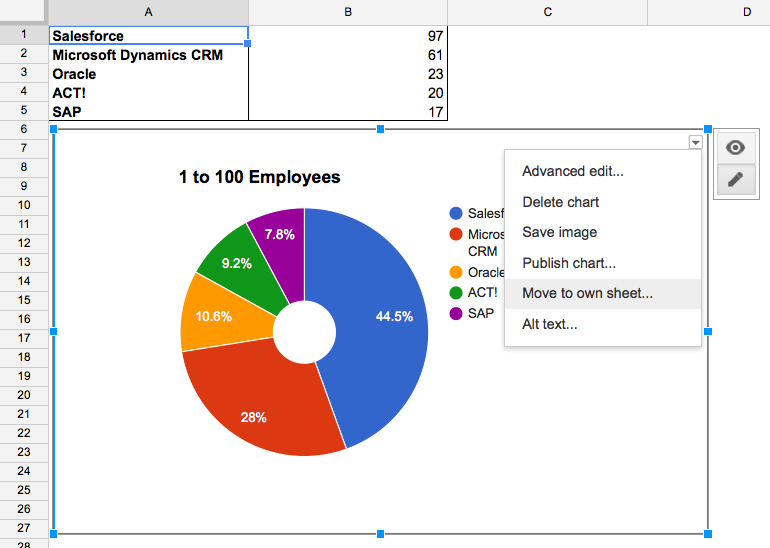
Click into a pivot table and add a chart. We recommend that you move the chart to its own sheet. This will make managing the published embed code easier. To do this, click on the arrow in the top right of the chart and select Move to own sheet…

Generate the Embed Code for the Chart
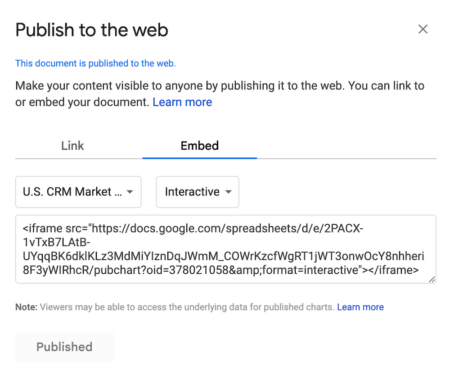
In Google Sheets, select File > Publish to the web…
Click on the dropdown that reads Entire Document and select a sheet containing a pivot table chart. After clicking the Publish button, you’ll see the code under the embed tab:

The embed code that Google Sheets provides is not dimensioned for most use cases, so the first thing to do is to add width and height parameters. We added width=”100%” height=”450″. We found that the scrollbars will disappear once the height exceeds a certain value.
A close look at the embed code above reveals several parameters. Here’s the function of each one.
Here are several examples of embedded charts from Google Sheets. Be sure to hover over the pie slices:
3D Pie Chart With Legend
2D Pie Chart With Legend
2D Pie Chart Without Legend
You may need to play around with the source sheet settings and the embed code parameters to get the desired results, but Google Sheets pivot table charts are an effective way to visually display data to your website visitors.


